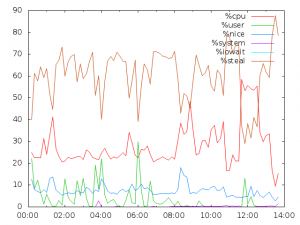
sar is very useful to monitor sys.res, following is a demo to paint gra. report using gnuplot.
gnuplot can be obtained from sf.(while it’s not GPL compatible license) http://gnuplot.sourceforge.net/
for Fedora users, just using yum install gnuplot to make the tool running.
#1, run sar command, and collect a sample of output. as: sar.txt
|
1 |
sar > sar.txt |
sample data: sar.txt
#2, handle the file, format for the tool, to :sar2.txt
|
1 |
cat sar.txt | sed -e '1,3d'| grep -v Average | cut -d' ' -f1,10- > sar2.txt |
sample data: sar2.txt
#3. run gnuplot with following cmd.
|
1 2 3 4 5 |
set autoscale set xdata time set timefmt "%H:%M:%S" set style data lines plot "sar2.txt" using 1:2 title "%user" , '' using 1:3 title "%nice", '' using 1:4 title "%system", '' using 1:5 title "%iowait", '' using 1:6 title "%steal", '' using 1:7 title "%idle" |
#4. paste the result of demo.

sar [-flags] [ -e time ] [ -f filename ] [-i sec ] [ -s time ]-f filename Uses filename as the data source for sar. The default is the current daily data file /var/adm/sa/sadd.-e time Selects data up to time. The default is 18:00.-i sec Selects data at intervals as close as possible to sec seconds.