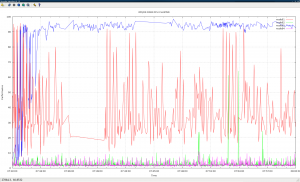
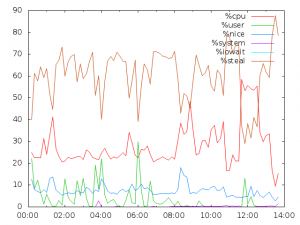
another post on sar graphical report with gnuplot
ipd/os is a very useful tool to monitor/collect system resource status, and from release 11.2.0.3, it’s now merged as a standard component of oracle clusterware.
the new name: oracle CHM(Cluster Healthy Monitor) shows it’s now a tool for clusterware/rac, it’s very useful to record resource usage and status upto 3days.
but ipd/os report is just plain txt with boring data, it’s a better way to show as a graphical report, gnuplot helps.
FOLLOWING DATA IS JUST USED FOR DEMO, DOESNT IMPLICATE ANY PERFORMANCE STATUS OF RUNNING PRODUCTION ENV.
here’s a sample data from classic ipd/os output(the newest chm output may contains tiny different on formatting), it contains sample data from 07:00:00-10:00:00 for node01.
ipdos_data_node01 <this sample file is very large 100M+…. not upload on this server…>
Whoever would like to get the sample data and want to try, please click here:
#1. get the time column.
|
|
grep Clock ipdos_data_node01.txt | awk '{print $5}'| sed s-'--g > time_node01.txt |
Sample: time_node01
Following, to retrieve necessary data on cpu/mem usage and iowait #.
#2. format the text, just collect usable data.
|
|
grep "#cpus" ipdos_data_node01.txt > resource_data_node01 sed -i s-;'.*'--g resource_data_node01 |
Sample:resource_data_node01
#3. get the cpu usage column.
|
|
awk '{print $4}' resource_data_node01 > cpu_node01.txt |
Sample:cpu_node01
#4. get the iowait number column.
|
|
awk '{print $20}' resource_data_node01 > iowait_data_node01.txt |
Sample:iowait_data_node01
#5. get memory usage column.
ipd/os just provide column memory free/total/cache, like:
|
|
physmemfree: 33068 physmemtotal: 5975632 mcache: 1869232 |
to calculate the usage%, need to use (physmemtotal – physmemfree – mcache) / physmemtotal *100%
so we need to get the 3 columns.
|
|
awk '{print "echo "scale=2;("$10"-"$8"-"$12")/"$10"*100"|bc -l"}' resource_data_node01 > mem_usage_node01.txt |
Sample:mem_usage_node01
run the file to get result..
|
|
. mem_usage_node01.txt > mem_node01.txt |
Sample: mem_node01
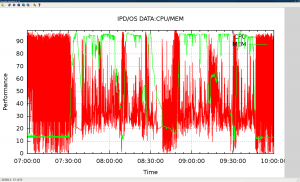
#6 get the report for cpu/mem usage.
|
|
paste time_node01.txt cpu_node01.txt mem_node01.txt > ipdos_cpu_mem_gnuplot_node01.txt |
Sample: ipdos_cpu_mem_gnuplot_node01
run gnuplot with following cmd:
|
|
set autoscale set xdata time set timefmt "%H.%M.%S" set ylabel "Performance" set xlabel "Time" set title "IPD/OS DATA:CPU/MEM" set xrange ["07.00":"10:00"] set yrange ["00:00" : "99:99" ] set grid set style data lines plot "ipdos_cpu_mem_gnuplot_node01.txt" using 1:2 title "CPU", '' using 1:3 title "MEM" |
#7 get report for iowait usage.
|
|
paste time_node01.txt iowait_data_node01.txt >ipdos_iow_gnuplot_node01.txt |
Sample: ipdos_iow_gnuplot_node01
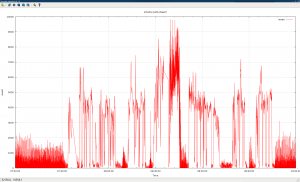
run gnuplot with following cmd:
|
|
set autoscale set xdata time set timefmt "%H.%M.%S" set ylabel "iowait" set xlabel "Time" set title "IPD/OS DATA:IOWAIT" set xrange ["07.00":"10:00"] set yrange ["0" : "9999" ] set grid set style data lines plot "ipdos_iow_gnuplot_node01.txt" using 1:2 title "iowait" |
#8. comparison on different nodes.
we can show data on 1node for a duration, and also it helps to compare different node status.
following is a sample to show a four-node cluster running cpu usage:
4 samples, each records the cpu usage,
Sample:
ipdos_cpu_mem_gnuplot_node01
ipdos_cpu_mem_gnuplot_node02
ipdos_cpu_mem_gnuplot_node03
ipdos_cpu_mem_gnuplot_node04
*** why not combine the 4 samples, merge into 1 text file?
well, if you watch into the 4files, they’re of different size(line#), different issues matter…
when some node evicted/rebooted, os data that time may lose on that node,
or when the sys stress is very very high, ipd/os will dump data using a longer interval (>1s).
So it’s fine to use different files, of course they all dumps the same duration 07:00:00-10:00:00.
gnuplot accepts different file inputs.
run gnuplot with following cmd:
|
|
set autoscale set xdata time set timefmt "%H.%M.%S" set ylabel "Performance" set xlabel "Time" set title "IPD/OS DATA CLUSTER " set xrange ["07.00":"10:00"] set yrange ["00:00" : "99:99" ] set grid set style data lines plot "ipdos_cpu_mem_gnuplot_node01.txt" using 1:2 title "node01", "ipdos_cpu_mem_gnuplot_node02.txt" using 1:2 title "node02", "ipdos_cpu_mem_gnuplot_node03.txt" using 1:2 title "node03", "ipdos_cpu_mem_gnuplot_node04.txt" using 1:2 title "node04" |
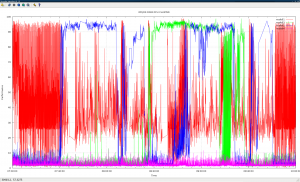
well seems it’s not very clear to put all data in this graphic, we can also just compare a short time.
|
|
set xrange ["07.30":"08:17"] |
and then plot the line…
