another post on sar graphical report with gnuplot
ipd/os is a very useful tool to monitor/collect system resource status, and from release 11.2.0.3, it’s now merged as a standard component of oracle clusterware.
the new name: oracle CHM(Cluster Healthy Monitor) shows it’s now a tool for clusterware/rac, it’s very useful to record resource usage and status upto 3days.
but ipd/os report is just plain txt with boring data, it’s a better way to show as a graphical report, gnuplot helps.
FOLLOWING DATA IS JUST USED FOR DEMO, DOESNT IMPLICATE ANY PERFORMANCE STATUS OF RUNNING PRODUCTION ENV.
here’s a sample data from classic ipd/os output(the newest chm output may contains tiny different on formatting), it contains sample data from 07:00:00-10:00:00 for node01.
ipdos_data_node01 <this sample file is very large 100M+…. not upload on this server…>
Whoever would like to get the sample data and want to try, please click here:
#1. get the time column.
|
1 |
grep Clock ipdos_data_node01.txt | awk '{print $5}'| sed s-'--g > time_node01.txt |
Sample: time_node01
Following, to retrieve necessary data on cpu/mem usage and iowait #.
#2. format the text, just collect usable data.
|
1 2 |
grep "#cpus" ipdos_data_node01.txt > resource_data_node01 sed -i s-;'.*'--g resource_data_node01 |
Sample:resource_data_node01
#3. get the cpu usage column.
|
1 |
awk '{print $4}' resource_data_node01 > cpu_node01.txt |
Sample:cpu_node01
#4. get the iowait number column.
|
1 |
awk '{print $20}' resource_data_node01 > iowait_data_node01.txt |
Sample:iowait_data_node01
#5. get memory usage column.
ipd/os just provide column memory free/total/cache, like:
|
1 |
physmemfree: 33068 physmemtotal: 5975632 mcache: 1869232 |
to calculate the usage%, need to use (physmemtotal – physmemfree – mcache) / physmemtotal *100%
so we need to get the 3 columns.
|
1 |
awk '{print "echo "scale=2;("$10"-"$8"-"$12")/"$10"*100"|bc -l"}' resource_data_node01 > mem_usage_node01.txt |
Sample:mem_usage_node01
run the file to get result..
|
1 |
. mem_usage_node01.txt > mem_node01.txt |
Sample: mem_node01
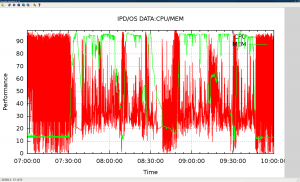
#6 get the report for cpu/mem usage.
|
1 |
paste time_node01.txt cpu_node01.txt mem_node01.txt > ipdos_cpu_mem_gnuplot_node01.txt |
Sample: ipdos_cpu_mem_gnuplot_node01
run gnuplot with following cmd:
|
1 2 3 4 5 6 7 8 9 10 11 |
set autoscale set xdata time set timefmt "%H.%M.%S" set ylabel "Performance" set xlabel "Time" set title "IPD/OS DATA:CPU/MEM" set xrange ["07.00":"10:00"] set yrange ["00:00" : "99:99" ] set grid set style data lines plot "ipdos_cpu_mem_gnuplot_node01.txt" using 1:2 title "CPU", '' using 1:3 title "MEM" |
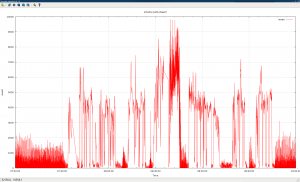
#7 get report for iowait usage.
|
1 |
paste time_node01.txt iowait_data_node01.txt >ipdos_iow_gnuplot_node01.txt |
Sample: ipdos_iow_gnuplot_node01
run gnuplot with following cmd:
|
1 2 3 4 5 6 7 8 9 10 11 |
set autoscale set xdata time set timefmt "%H.%M.%S" set ylabel "iowait" set xlabel "Time" set title "IPD/OS DATA:IOWAIT" set xrange ["07.00":"10:00"] set yrange ["0" : "9999" ] set grid set style data lines plot "ipdos_iow_gnuplot_node01.txt" using 1:2 title "iowait" |
#8. comparison on different nodes.
we can show data on 1node for a duration, and also it helps to compare different node status.
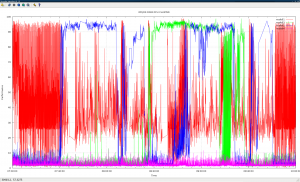
following is a sample to show a four-node cluster running cpu usage:
4 samples, each records the cpu usage,
Sample:
ipdos_cpu_mem_gnuplot_node01
ipdos_cpu_mem_gnuplot_node02
ipdos_cpu_mem_gnuplot_node03
ipdos_cpu_mem_gnuplot_node04
*** why not combine the 4 samples, merge into 1 text file?
well, if you watch into the 4files, they’re of different size(line#), different issues matter…
when some node evicted/rebooted, os data that time may lose on that node,
or when the sys stress is very very high, ipd/os will dump data using a longer interval (>1s).
So it’s fine to use different files, of course they all dumps the same duration 07:00:00-10:00:00.
gnuplot accepts different file inputs.
run gnuplot with following cmd:
|
1 2 3 4 5 6 7 8 9 10 11 |
set autoscale set xdata time set timefmt "%H.%M.%S" set ylabel "Performance" set xlabel "Time" set title "IPD/OS DATA CLUSTER " set xrange ["07.00":"10:00"] set yrange ["00:00" : "99:99" ] set grid set style data lines plot "ipdos_cpu_mem_gnuplot_node01.txt" using 1:2 title "node01", "ipdos_cpu_mem_gnuplot_node02.txt" using 1:2 title "node02", "ipdos_cpu_mem_gnuplot_node03.txt" using 1:2 title "node03", "ipdos_cpu_mem_gnuplot_node04.txt" using 1:2 title "node04" |
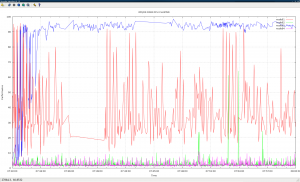
well seems it’s not very clear to put all data in this graphic, we can also just compare a short time.
|
1 |
set xrange ["07.30":"08:17"] |


What you’re looking at is the current activity of the system. The current activity view is used to watch the server, but it is only as historical as the time spanned on the screen, and only that portion can be saved off for later review. For historical monitoring, double-click the Performance Logs and Alerts item on the left of the tool, and then click the Counter Logs item. Right click in the right-hand panel to create a new log. This is where you collect the objects and their counters to a file. This file can be an ASCII file or a binary file. In Windows 2003, you can also save these logs to a SQL Server database. Usually the best option is the binary file, since it takes less of a performance hit than the ASCII file, even though the ASCII model makes for smaller files.
Now, we also want to check for the status of the database and the state of its content index as we did previously. Based on all the possible values, we want the Status attribute of all mailbox databases to be either Mounted (for the server where the database is mounted) or Healthy (for the servers that hold a copy of it). For the ContentIndexState attribute we want it to be always Healthy.